
What happened last week.
What we’re watching for next week.
Chart 1. S&P periodic returns.
Market finally broke through resistance at 2872, sending the rally-sellers scurrying for places to hide. All periods in this chart show positive returns. All together now… “Don’t fight the tape!”

Chart 2. S&P key markers
This little table shows how far away the market is from key markers, like the previous low for this correction, and the key moving averages that chartists watch.
S&P now has a new support price (Friday’s close). The index is sitting comfortably above the key moving average markets that chartists like to watch. For now, all is well.
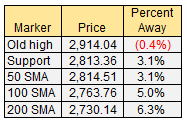
Chart 3. Breadth 1 – % of stocks trading above their 200 day moving average
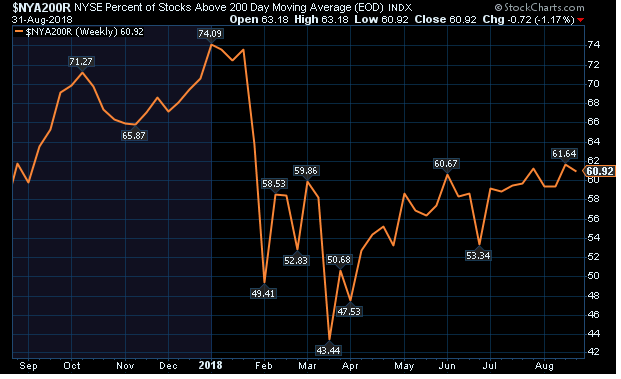
Chart 4. Breadth 2 – % of stocks trading above their 50 day moving average
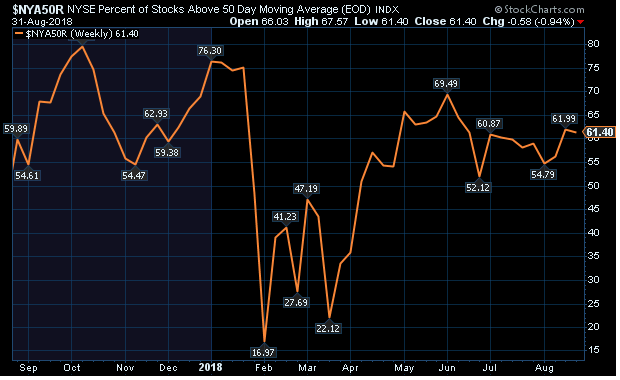
Chart 5. Treasury yield curve (10-year – 1-month)
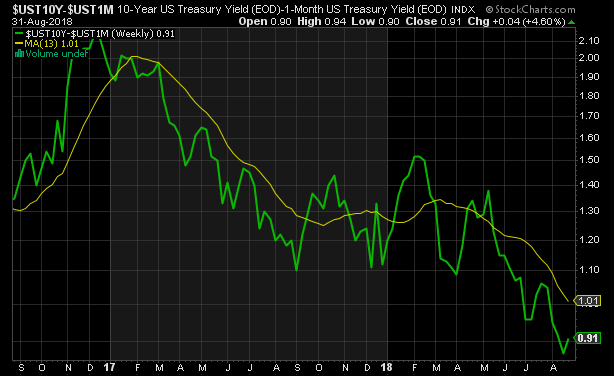
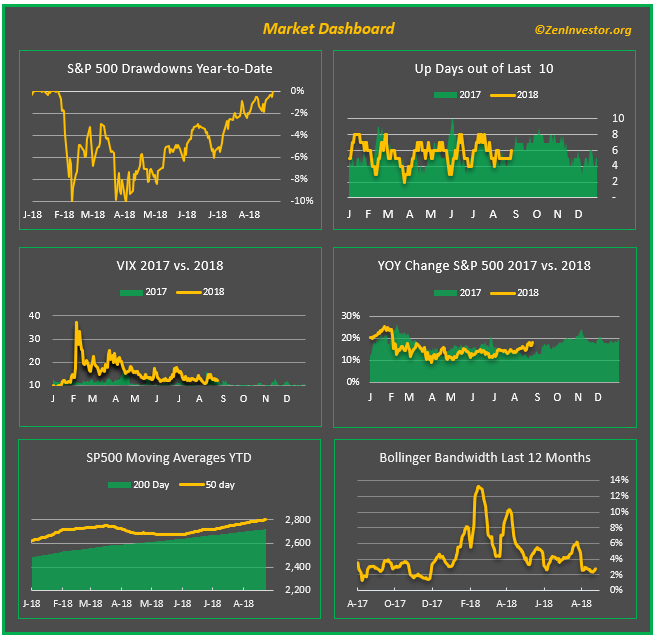
Chart 6. The market dashboard
More confirmation that the bulls are in charge. The bulls are the new boss, and the bears are in hiding. For now. Here’s the caveat – when we are in a sweet spot in the market, and this is one of those times, be wary of complacency, because as soon as you take your eye off the market it will probably begin to misbehave again. Next time, the correction may not stop at -10%. It could get much worse than that.
Final thoughts
This week I’m watching the yield curve as it gets closer to flat. Also the breadth of the market, because despite a healthy reading above 50%, it’s been trending sideways as the market broke through the old high. Maybe it’s nothing, but I’m interested.
We have the unemployment report on Friday, and the pundits are expecting another very good number. This is another vulnerable spot, because the number could be weaker than expected, and/or the average hourly earnings could come in stronger than expected. If that happens, I’ll be happy for our underpaid workers, but the rich folks who control the market will not be so happy.
This has been another down-and-dirty recap of last week’s market action and some things to watch for next week. Comments so far have been very positive, and I thank all who took the time. I will keep tweaking this report, while also trying to keep it fairly consistent.
As always, if you like what you see, or have suggestions for improving this recap, leave a comment below, or email me at info@zeninvestor.org