
Here’s what happened in the market last week, and what to watch for next week.
Chart 1. S&P periodic returns.
Market is firing on all cylinders – dip buyers still have the advantage – can they push through and make a new high? That’s what we’ll be watching for next week.
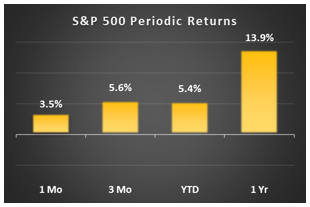
Chart 2. S&P drawdowns
Market dropped quickly in late January, tried to rally, dropped again in late March. Worst drawdown so far is 10%. Market now within shouting distance (1.9%) of the previous high. Will it cross the finish line? We’ll be watching this.
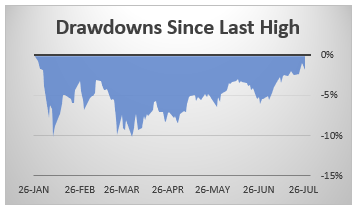
Chart 3. S&P key markers
Market technicals still positive – S&P is well above support (2581) – and still moderately above 50 and 200 day moving averages. Watch for a breakout above 2873 or a dip below 2761 (50 dma). These two markers are what chartists are watching, and they’ll get motivated to do something when either marker is breached.
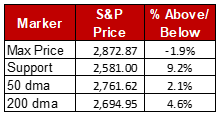
Chart 4. Biggest winners & losers, just from today’s market action.
I just threw this in here because I find it interesting. It really has no bearing on the overall status of the market.
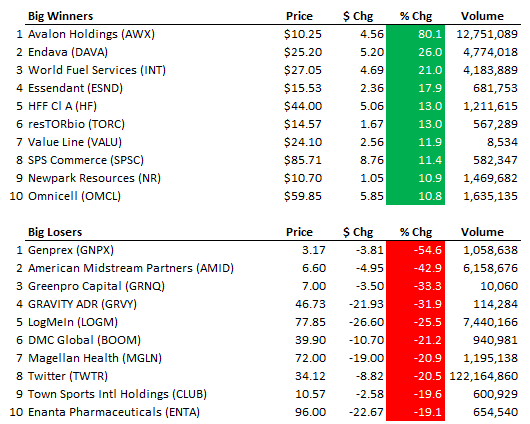
Chart 5. The market dashboard
This is what I look at every day for a quick take on the market. It shows drawdowns, momentum, and volatility all on one graphic. Right now, the dip buyers have the upper hand. They have pushed the rally sellers up against the wall at 2872. I’ll be watching closely to see which of these two camps ultimately prevails. (My money is on the dip buyers, but I could be wrong.)

Final thoughts
There you have it. A down-and-dirty recap of last week’s market action and some things to watch for next week. If you like what you see, or have suggestions for improving this recap, leave a comment below.
______________________________________________________________________________
This report was brought to you by…

(It’s got what plants crave.)